
How to Assess if My Portfolio Risk Is Too High: A Professional Audit for 2026
What if the anxiety you feel during a market dip isn't a sign of a failing market, but a signal that your portfolio is mathematically misaligned with your psychological limits? Many investors struggle with how to assess if my portfolio risk is too high, especially as the Federal Reserve maintains a target range of 3.5% to 3.75% in April 2026. You likely feel the weight of conflicting advice and the pressure of a higher-for-longer interest rate environment where the bank prime rate sits at 6.75%. It's natural to feel overwhelmed by the technicalities of measuring volatility or the concentration risk inherent in today's tech-heavy indices.
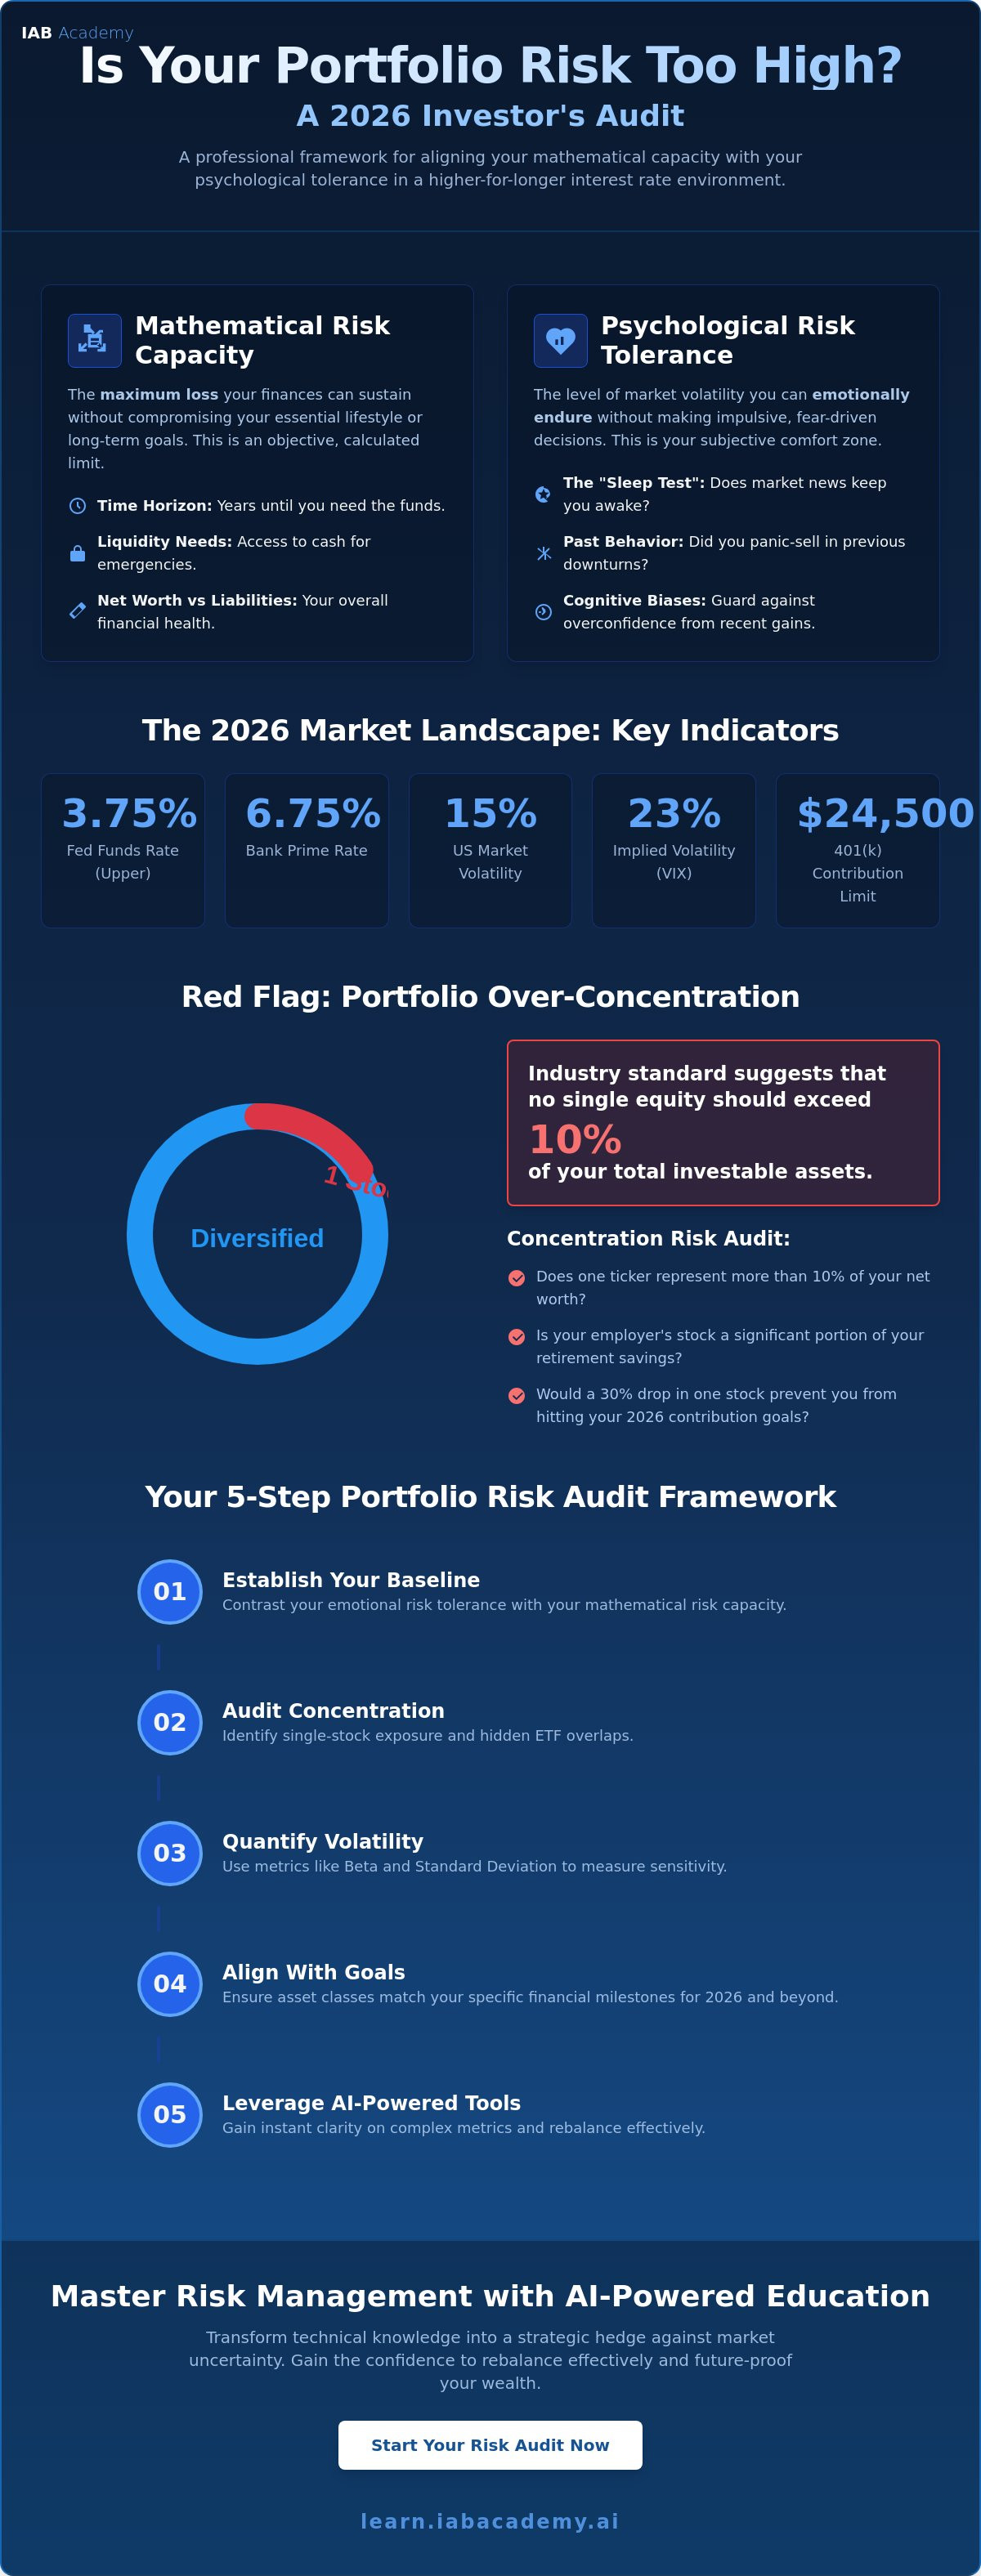
We recognize that risk is not a static number; it's a dynamic alignment between your mathematical capacity to lose and your psychological ability to hold. This professional audit provides the quantitative frameworks and mastery needed to determine if your current strategy aligns with your 2026 financial goals. You'll gain a definitive "Yes" or "No" regarding your risk exposure and the technical confidence to rebalance effectively. We will examine the gap between 23% implied volatility and realized trends, evaluate your 2026 contribution strategies against the $24,500 401(k) limit, and leverage AI-driven risk management tools to future-proof your wealth.
Key Takeaways
- Contrast emotional risk tolerance with mathematical risk capacity to establish a rigorous baseline for your 2026 investment strategy.
- Discover how to assess if my portfolio risk is too high by auditing single-stock exposure and identifying hidden concentration within overlapping ETF holdings.
- Master quantitative frameworks, such as Beta and Standard Deviation, to measure portfolio sensitivity against the current 3.75% federal funds rate environment.
- Execute a systematic 5-step risk audit to ensure your asset classes remain strictly aligned with your specific financial milestones and long-term objectives.
- Leverage AI-powered instructional tools to gain instant clarity on complex metrics, transforming technical knowledge into a strategic hedge against market uncertainty.
Defining 'Too High': Risk Capacity vs. Risk Tolerance in 2026
In the April 2026 financial climate, many investors struggle with how to assess if my portfolio risk is too high. The answer isn't found in a gut feeling; it's a structural calculation based on your unique financial ecosystem. While market volatility (VIX) has declined 22% from its late 2025 highs, the fundamental definition of "too high" remains anchored in your lifestyle. A portfolio's risk level is excessive when a 20% drawdown forces you to compromise essential spending or liquidate assets at a loss. This threshold is dictated by the interplay between your psychological resilience and your mathematical capacity to withstand market shocks.
The 2026 market context has shifted traditional benchmarks. High concentration in AI stocks and the integration of digital assets have pushed the annualized volatility of the CRSP US Total Market Index to 15%. With the federal funds rate held between 3.5% and 3.75%, the cost of being wrong has increased. You must distinguish between the emotional discomfort of a dip and the objective threat to your solvency.
The Mathematical Reality: Defining Risk Capacity
Risk Capacity represents the objective ceiling of your investment strategy. It's determined by your time horizon, liquidity requirements, and total net worth relative to your liabilities. If you're a single filer in the 22% tax bracket earning over $50,400, your capacity to absorb losses differs significantly from a high-earner in the 37% bracket. You must identify your "Critical Loss Threshold," which is the point where long-term objectives like retirement or legacy planning become statistically unachievable. Risk Capacity is the maximum loss an investor can sustain without altering their standard of living. This concept builds upon Modern Portfolio Theory, which seeks to optimize returns for specific risk levels, yet it adds a layer of personal financial survival that technical models often ignore.
The Psychological Threshold: Understanding Risk Tolerance
Risk Tolerance is the subjective counterpart to capacity. Professionals often measure this via the "Sleep Test." If market fluctuations cause physiological stress or lead to impulsive selling, your allocation is misaligned with your temperament. Past behavior is the most reliable predictor of future tolerance. Review your actions during early 2026 when implied volatility climbed above 23%. Did you maintain your position, or did you seek safety in cash? Investors must guard against recency bias. In bull markets driven by S&P 500 earnings growth, which is expected to hit 13% in Q1 2026, it's easy to overestimate your grit. True tolerance is only revealed when the market tests your resolve, not when it rewards your participation.
Identifying Red Flags: Is Your Portfolio Over-Concentrated?
Concentration risk is often the silent catalyst for financial insolvency. While professional asset managers utilize sophisticated attribution models, retail investors frequently overlook how a single asset's growth can distort their entire risk profile. To understand how to assess if my portfolio risk is too high, you must first quantify your exposure to individual securities. Industry standards suggest that no single equity should exceed 10% of your total investable assets. Exceeding this threshold creates a structural vulnerability where the idiosyncratic risk of one company outweighs the systemic benefits of a diversified strategy.
Many investors fall into the "Tax Trap," where significant unrealized gains in a concentrated position discourage rebalancing. In April 2026, single filers with taxable income over $545,500 face a 20% long-term capital gains tax rate, plus the 3.8% Net Investment Income Tax. This fiscal friction often leads to paralysis, yet holding a bloated position is a gamble on continued outperformance. Understanding the dangers of concentration risk is essential for maintaining a resilient portfolio. Use this checklist to audit your holdings:
- Does one ticker represent more than 10% of your net worth?
- Does your employer's stock constitute a significant portion of your retirement savings?
- Would a 30% drop in one specific stock prevent you from hitting your 2026 401(k) contribution limit of $24,500?
Sector Overlap and Hidden Correlations
Diversification is frequently an illusion in the 2026 market ecosystem. The S&P 500 remains heavily concentrated in dominant technology firms trading at high multiples. If you hold a total market ETF, a technology-sector fund, and a growth-oriented mutual fund, you likely have "hidden concentration." A stock screener can reveal that these three distinct vehicles often hold the same top five AI-driven companies. This overlap means your portfolio may be far more sensitive to tech-sector volatility than you realize. When interest rates remain "higher-for-longer," as evidenced by the 6.75% prime rate in April 2026, correlations between growth stocks tend to tighten.
This phenomenon is a core part of stock market fundamentals. True diversification requires looking beyond asset names and into the underlying holdings. If you're ready to master these advanced metrics, you can explore professional certification paths to refine your strategy. Avoiding "Home Bias" by including international exposure is also critical, as US equity markets currently trade at a premium compared to emerging ecosystems. Concentrated positions are the primary destroyers of fortunes during volatile cycles; professional mastery lies in knowing when to prune.
Quantitative Methods for Assessing Portfolio Volatility
Professional risk management requires moving beyond qualitative intuition into the domain of statistical verification. To understand how to assess if my portfolio risk is too high, you must utilize standardized metrics that strip away emotional bias. In the current market cycle, where realized volatility has remained below 14% despite spikes in implied volatility, relying on hard data is the only way to maintain strategic discipline. High returns are often celebrated in isolation, yet without risk-adjustment, they frequently signal a portfolio that is over-leveraged or over-exposed to systemic shocks. Evaluating your "risk-adjusted return" ensures that your gains aren't merely the result of taking reckless levels of market sensitivity.
The Sharpe Ratio serves as a critical diagnostic tool here. It measures the excess return of your portfolio relative to the risk-free rate, which is currently anchored by the 3.5% to 3.75% federal funds rate. A low Sharpe Ratio despite high nominal returns indicates that you're taking excessive risks for every unit of profit. This imbalance is often a precursor to capitulation during a correction. By quantifying these relationships, you transform your investment strategy from a series of guesses into a professional-grade financial framework.
Standard Deviation and Beta: The Traditional Metrics
Most modern brokerage platforms provide a "Portfolio Characteristics" tab where you can locate your weighted Beta. This metric measures your portfolio's sensitivity to the broader market, typically the S&P 500. A Portfolio Beta greater than 1.2 indicates that your holdings are 20% more volatile than the market average. This level of sensitivity can be catastrophic during sudden liquidity crunches. Standard deviation quantifies the variance of an assets price from its average, serving as a proxy for market volatility. If your portfolio's standard deviation significantly exceeds the 15% annualized average of the CRSP US Total Market Index, your strategy may be misaligned with your stated risk capacity.
Drawdown Analysis: Measuring the Worst-Case Scenario
Maximum Drawdown is the most sobering metric for any investor. It measures the largest peak-to-trough decline in your portfolio's value before a new peak is achieved. To stress-test your current allocation, you should simulate how your holdings would have performed during the 2022 inflationary spike or the 2024 market rotations. This simulation reveals the "Time to Recovery," which is the duration required for your portfolio to return to its previous high. If your recovery time exceeds your liquidity needs, your risk is objectively too high. In a 6.75% prime rate environment, the opportunity cost of waiting years for a recovery is a significant drag on your long-term wealth accumulation.
The 5-Step Portfolio Risk Audit Framework
Professional asset management requires a transition from passive observation to active, systematic auditing. To determine how to assess if my portfolio risk is too high, you must implement a quarterly review that validates your exposure against evolving market conditions. This framework ensures that your capital remains aligned with your mathematical capacity for loss; it protects your long-term solvency from the volatility of the 2026 digital ecosystem. Professionals don't rely on hope. They rely on repeatable, high-density audits that identify vulnerabilities before they manifest as realized losses.
Step 1: Aligning Assets with Time Horizons
Divide your holdings into distinct buckets based on liquidity needs. The short-term bucket, covering expenses for the next one to three years, should have zero exposure to high-volatility AI stocks or aggressive growth equities. This capital must remain in low-risk instruments to offset the 6.75% prime rate. To master how to assess if my portfolio risk is too high, start by ensuring your immediate cash needs aren't tied to the 15% annualized volatility of the equity markets. Refer to our financial literacy curriculum to refine your wealth-building timelines and ensure your buckets are properly funded.
Step 2: Stress-Testing Against Macro-Economic Shifts
Evaluate how your assets respond to systemic shocks. In an environment where US GDP growth is approximately 2.2% and the unemployment rate sits near 4.5%, traditional correlations often break down during market contractions. You must identify if your "diversified" assets all move in the same direction when interest rates shift. Utilizing macro-economic analysis for traders allows you to anticipate these external threats before they compromise your principal. A robust audit simulates a 20% drawdown to confirm your strategy survives a "higher-for-longer" interest rate policy.
Step 3: Rebalancing and Risk Mitigation
Establish strict tolerance bands of plus or minus 5% for your target asset allocation. When a sector like AI grows to dominate your portfolio, you must rebalance to return to your baseline. This discipline prevents the "drift" that often leads to accidental over-concentration. Implement mechanical risk management tools, such as stop-loss orders, to automate the preservation of capital. This removes emotional friction from the decision-making process. If your audit results suggest you've hit your Critical Loss Threshold, move immediately from a growth-oriented stance to a preservation mode.
The final phases of the audit involve Step 4: Tax-Efficient Realignment and Step 5: Strategic Verification. During realignment, utilize the 2026 standard deduction of $16,100 for single filers to offset rebalancing costs. Finally, verify that your risk levels still support your specific life milestones. If your audit reveals a significant imbalance, access our professional development resources to calibrate your rebalancing strategy and maintain industry-standard compliance.
Mastering Risk Management with AI-Powered Education
In the 2026 digital ecosystem, the ultimate hedge against market uncertainty isn't a specific asset class; it's the mastery of the systems that govern them. While institutional hedging activity has risen alongside the 22% decline in the VIX since December 2025, the individual investor's greatest risk remains a lack of specialized knowledge. Understanding how to assess if my portfolio risk is too high is no longer a manual task involving static spreadsheets. It's a continuous process of professional development that leverages high-density information to bridge the gap between theoretical risk and realized outcomes. Education serves as the definitive framework for career and financial survival in a market where geopolitical tensions and policy shifts can trigger rapid correlation breakdowns.
Transitioning from a novice observer to a master of risk management requires a commitment to excellence and a deep immersion in modern financial standards. The IAB Academy provides the instructional rigor necessary to navigate this landscape. By moving beyond surface-level advice, you can establish a sense of stability and reliability in your long-term strategy. This mastery is not optional; it's essential for anyone seeking to maintain professional credibility and financial health during the complex economic cycles of 2026.
How AI Trading Assistants Simplify Risk Modeling
AI is being embedded as an operating system across investment workflows, accelerating research and enhancing portfolio construction. These tools excel at processing vast datasets to identify non-obvious correlations that human analysis might overlook. For example, while the S&P 500's 30-day implied volatility climbed above 23% in early 2026, AI models helped professionals identify that realized volatility remained below 14%. This clarity reduces the "Emotional Gap" that leads to poor decision-making during market dips. However, investing in AI itself requires a specialized risk framework to account for high multiples and concentration risk in dominant technology firms.
Future-Proofing Your Portfolio through IAB Academy
The IAB Academy’s approach combines human-centered fundamentals with the speed of AI-powered tutors like the Smart Instructor™. These tools provide instant clarity on complex metrics like Beta or the Sharpe Ratio, ensuring that the stakes of your learning are met with the most accurate information available. To build a resilient foundation, you should consider choosing the right personal finance class that aligns with 2026 standards. This curriculum offers lifetime access to evolving financial strategies, allowing you to future-proof your wealth against the "higher-for-longer" interest rate environment. Master your risk before the market tests it for you; professional validation is the only way to ensure your strategy survives the next shift in the global ecosystem.
Securing Your Financial Future Through Professional Mastery
Mastering the technical alignment between your risk capacity and your portfolio's volatility is the only way to ensure long-term solvency in the 2026 market. You now possess the professional frameworks to identify hidden concentration and utilize Beta as a diagnostic tool. Understanding how to assess if my portfolio risk is too high is a vital skill that protects your capital from the 15% annualized volatility of the current US equity market. Relying on intuition isn't sufficient when the bank prime rate remains at 6.75%.
To deepen your expertise, enroll in the IAB Academy Financial Literacy Curriculum to Master Risk Management. This program provides Smart Instructor™ AI support in 130+ languages and grants professional certification upon completion. You'll also benefit from lifetime access to all future course updates as the global digital ecosystem evolves. Take command of your financial trajectory today. With the right tools and a disciplined audit process, you can navigate market turbulence with the absolute confidence of an industry leader.
Frequently Asked Questions
How do I know if I am taking too much risk for my age?
You are taking too much risk if your portfolio's recovery time exceeds your remaining time horizon before a major life milestone. If you are within five years of retirement, a portfolio with a Beta above 1.0 is mathematically misaligned with your capacity to absorb the 15% annualized volatility currently seen in the CRSP US Total Market Index. Your age dictates the duration you can wait for a market rebound before being forced to liquidate assets at a loss.
What is a "safe" percentage of my portfolio to keep in high-growth AI stocks?
Professional standards suggest limiting exposure to any single high-growth sector to 15% of your total investable assets. While S&P 500 earnings are expected to grow by 13% in Q1 2026, over-concentration in AI increases your sensitivity to interest rate shifts. With the bank prime rate at 6.75%, these high-multiple stocks face increased pressure if "higher-for-longer" policies persist.
Can I measure my portfolio risk for free without a financial advisor?
You can utilize the "Portfolio Characteristics" or "Risk Metrics" tabs on most major brokerage platforms to find your weighted Beta and Standard Deviation. To understand how to assess if my portfolio risk is too high, compare your portfolio's Standard Deviation to the 14.92% historical average. This self-service audit provides a professional-grade baseline for your risk exposure without requiring external consultation fees.
What happens to my risk level if the stock market enters a capitulation phase?
Your risk level escalates as correlations between previously unrelated asset classes tend to tighten during systemic crashes. In a capitulation phase, the "Time to Recovery" becomes your most critical metric. If your recovery window exceeds your short-term liquidity bucket of one to three years, your risk is objectively too high because you may be forced to sell during the market trough.
Is a 100% stock portfolio always considered "too high" risk?
It isn't always "too high" if your time horizon exceeds ten years and your liquidity needs are met by cash reserves. However, a 100% equity allocation is high-risk by definition because it lacks the stabilization of fixed-income assets. This strategy remains highly sensitive to the 23% implied volatility spikes that characterized the market in early 2026.
How often should I perform a risk audit on my investments?
Conduct a formal risk audit at least once per quarter to account for asset drift and macro-economic shifts. Regular reviews are essential to determine how to assess if my portfolio risk is too high after significant price movements in tech sectors. Frequent auditing ensures your portfolio doesn't accidentally become over-concentrated during prolonged bull markets.
What is the difference between market risk and inflation risk?
Market risk is the potential for principal loss due to price fluctuations, while inflation risk is the erosion of your purchasing power over time. In 2026, with the federal funds rate at 3.5% to 3.75%, holding excessive cash may lower your market risk but significantly increases your inflation risk. A professional strategy seeks to balance these two competing threats to maintain real wealth.
How can AI help me lower my investment risk?
AI lowers risk by identifying non-obvious correlations across global datasets and automating mechanical stop-loss orders. These tools reduce the "Emotional Gap" during market dips by focusing on realized volatility rather than fear-driven sentiment. By processing data at scale, AI assistants help you maintain a disciplined rebalancing schedule that is often difficult to execute manually.
