How to Learn Technical Analysis from Scratch: A Professional 2026 Roadmap
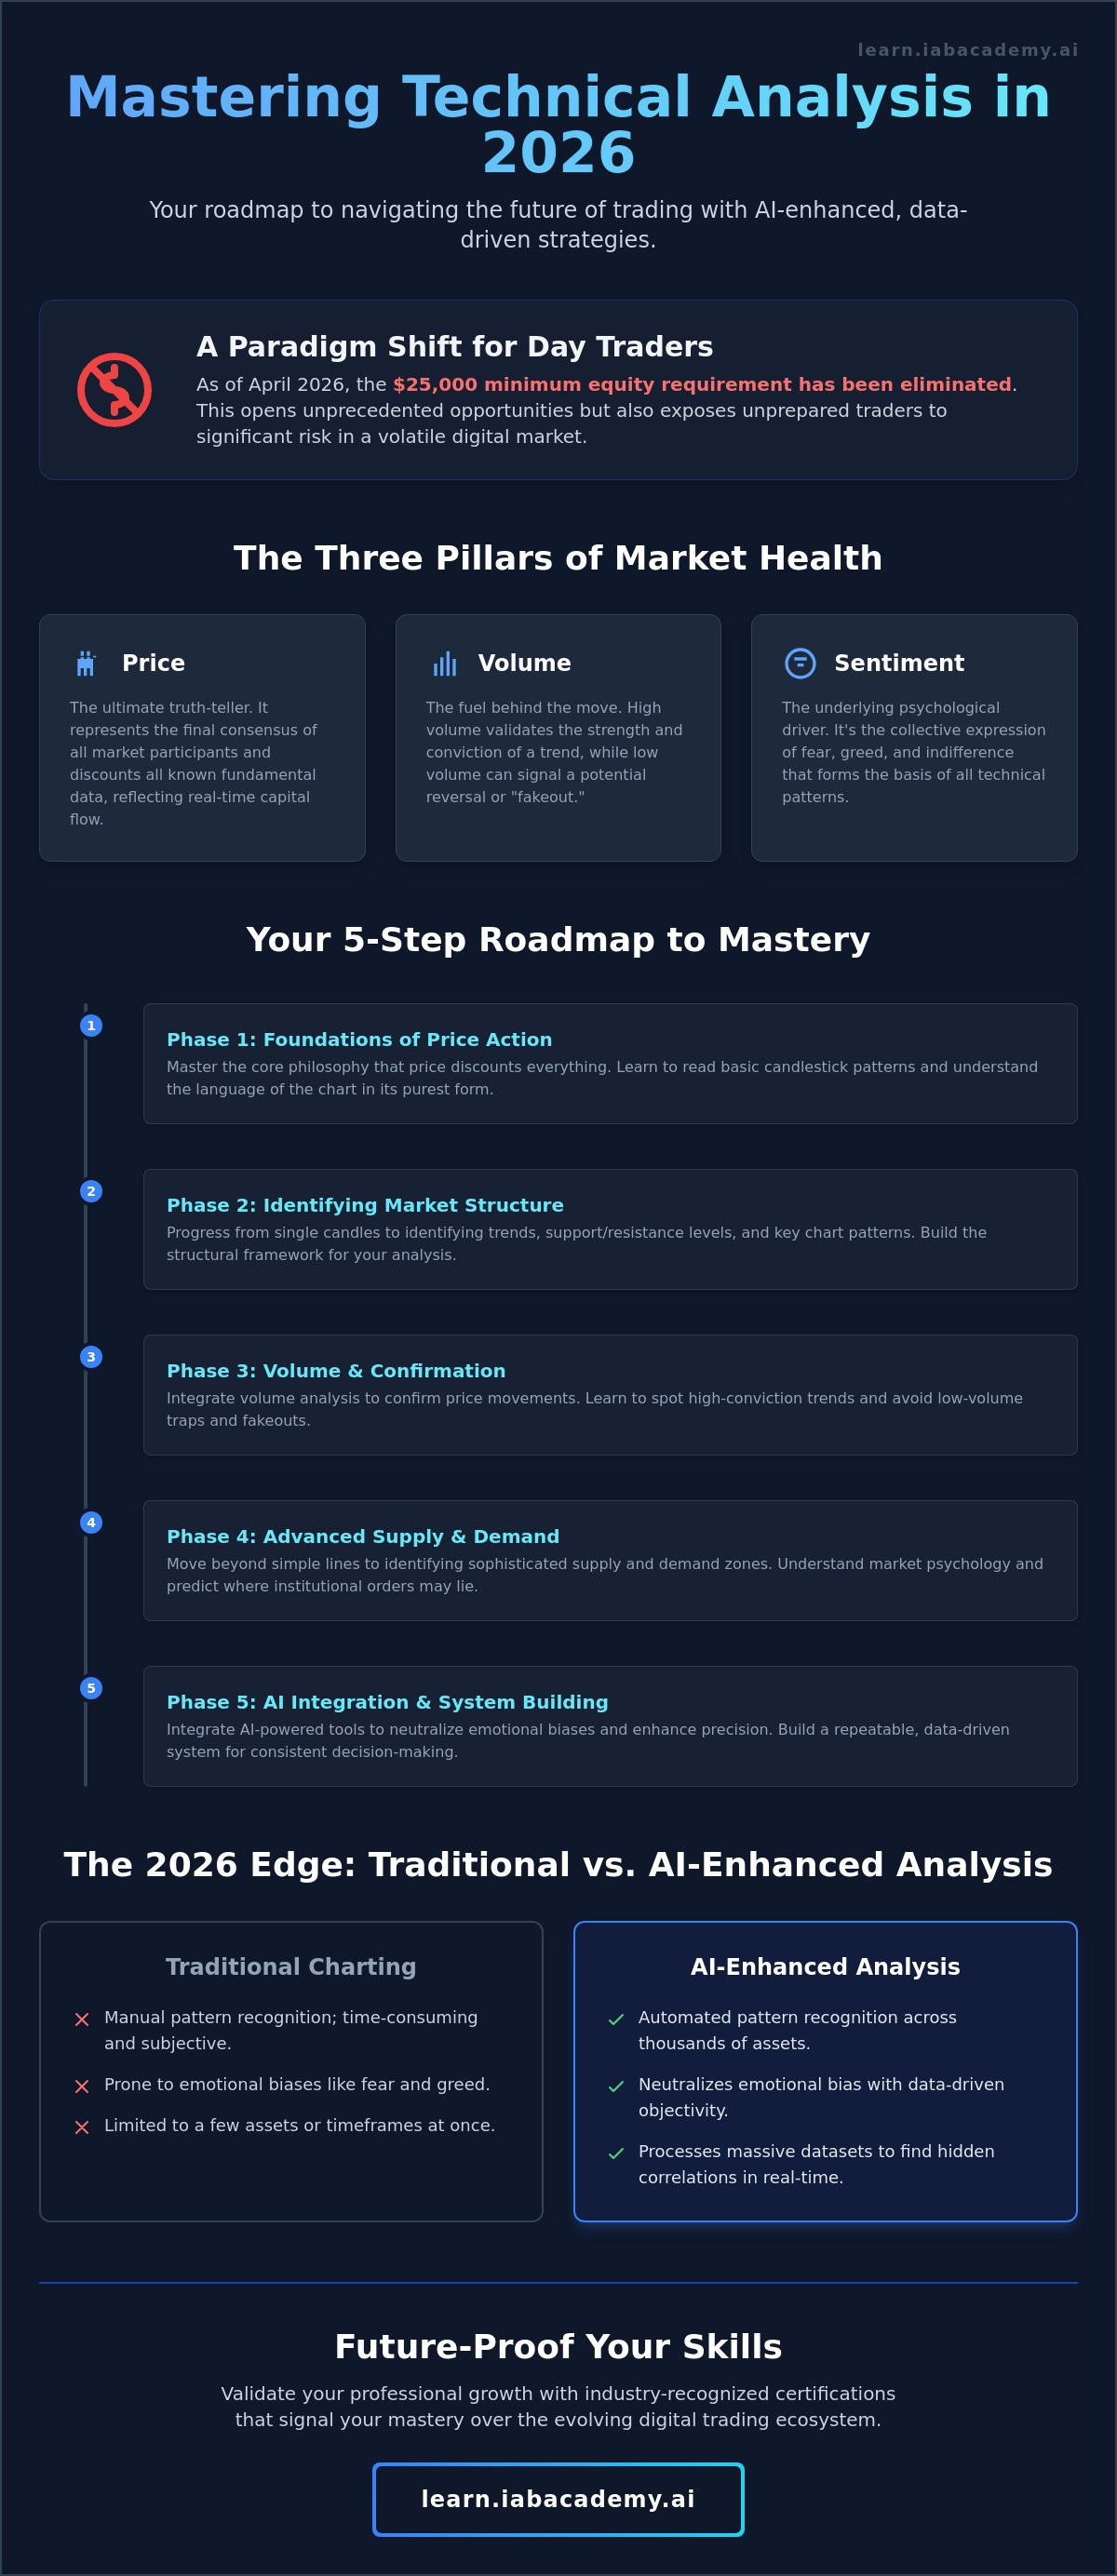
Did you know that as of April 2026, the $25,000 minimum equity requirement for day traders has been officially eliminated by FINRA? This regulatory shift opens the doors for millions of retail investors; however, it also exposes unprepared participants to significant risk in an increasingly volatile digital ecosystem. You've likely felt the exhaustion of information overload from conflicting gurus or the fear that technical complexity is a barrier you can't cross. It's difficult to find a clear signal amidst the noise of modern trading platforms without a professional foundation.
This roadmap ensures you learn technical analysis from scratch by moving beyond surface-level indicators into a deep mastery of market psychology. We provide the instructional clarity needed to decode price action using modern, AI-enhanced techniques. You'll build a repeatable, data-driven system for identifying opportunities and gain the confidence to read any chart with professional precision.
Our guide previews the integration of automated pattern recognition, explains the shift to real-time margin calculations, and outlines a professional path toward certification. This is your definitive resource for future-proofing your skills and achieving excellence in a high-stakes market.
Key Takeaways
- Master the core philosophy that price action discounts all fundamental data, allowing you to interpret market psychology through a purely objective lens.
- Execute a disciplined five-phase roadmap to learn technical analysis from scratch, progressing from basic candle reading to identifying sophisticated supply and demand zones.
- Decode the three pillars of market health; price, volume, and sentiment; to establish a data-driven foundation that remains resilient across various asset classes.
- Integrate AI-powered analysis tools into your workflow to neutralize emotional biases and enhance the precision of your strategic decision-making.
- Validate your professional growth with industry-recognized certifications that signal your mastery over the evolving digital trading ecosystem.
What is Technical Analysis? Decoding the Language of the Market
Technical analysis is the systematic study of historical price action and volume to forecast future market direction. While some view it as mere chart pattern recognition, it's actually the visual representation of supply and demand dynamics within the global digital ecosystem. To define What is Technical Analysis? is to understand that every trade represents a human or algorithmic decision recorded on a ledger of price. This discipline operates on the core philosophy that price discounts everything. This means that all known information, from corporate earnings to geopolitical shifts, is already reflected in the current market value.
When you learn technical analysis from scratch in 2026, you're acquiring a future-proofing skill that remains relevant despite the rise of automated high-frequency trading. As the SEC's 2026 examination priorities shift toward the governance of AI in financial firms, the ability to manually verify and interpret price signals becomes a critical layer of professional compliance and risk management. It's a foundational competency for any serious professional looking to maintain mastery over their capital.
The Core Assumptions of Technical Analysis
The foundation of every professional strategy rests on the axiom that the market moves in trends. Prices don't move randomly. They oscillate in established directions that persist until a clear reversal occurs. This persistence is driven by the concept that history tends to repeat itself, a phenomenon rooted in the collective psychology of fear and greed. The TradingView community's contribution of over 150,000 custom scripts by early 2026 demonstrates the ongoing global effort to quantify these recurring psychological patterns. Within this framework, the Efficient Market Hypothesis suggests that asset prices reflect all available information, making it impossible to consistently achieve alpha through fundamental insights alone.
Technical vs. Fundamental Analysis: A Professional Synergy
Professional traders distinguish between the "What" and the "Why" of the market. Technical analysis focuses on the "What": the actual movement of price. Fundamental analysis investigates the "Why": the underlying economic drivers. In the 2026 landscape, AI-powered tools bridge these disciplines by processing massive datasets to find correlations between sentiment and price action. Before mastering these advanced techniques, you must establish a baseline understanding of stock market fundamentals.
This synergy allows you to use fundamentals to filter for high-quality assets while using technicals to time your entries and exits with precision. It's a modular approach to learning that ensures you aren't just memorizing patterns but building a data-driven trading foundation. Mastery of both disciplines ensures you can identify a repeatable system for identifying opportunities in any market condition. You won't just be guessing; you'll be executing a professional strategy based on the visual language of the markets.
The Three Pillars of Technical Analysis: Price, Volume, and Sentiment
To master the visual language of the markets, you must first strip the chart of its complexity and focus on its raw components. Professional traders rely on The Three Pillars of Technical Analysis to establish a data-driven foundation. Price action is the most honest indicator of market health because it represents the final consensus of all participants at any given second. While indicators might lag, price shows you exactly where the capital is flowing in real time. Volume acts as the fuel that confirms or denies these price movements. A significant price surge on low volume often lacks conviction and suggests a potential "fakeout," whereas high volume validates the strength of a trend.
The third and often overlooked pillar is market sentiment. While price and volume are quantitative, sentiment is the underlying psychological driver of every technical pattern. It's the collective expression of fear, greed, and indifference. When you learn technical analysis from scratch, you aren't just looking for lines on a screen; you're identifying the emotional state of the global digital ecosystem. If you're ready to accelerate your progress, exploring a Novice Investors Course can provide the structured environment needed for professional growth.
Mastering Price Action: Candlesticks and Trends
Japanese candlesticks are the standard for professional charting because they provide a granular view of market behavior. Each candle consists of the Open, High, Low, and Close (OHLC) for a specific timeframe. The body shows the range between the open and close, while the wicks represent price rejection. Understanding these is essential for identifying the three primary trend types: the uptrend (characterized by higher highs and higher lows), the downtrend (lower highs and lower lows), and sideways consolidation (where price moves within a horizontal range).
Quick Reference: Basic Candle Patterns
- Bullish Engulfing: A large green candle that completely covers the previous red candle, signaling a strong reversal to the upside.
- Bearish Engulfing: A large red candle that swallows the previous green candle, indicating dominant selling pressure.
- Doji: A candle with a very small body where the open and close are nearly identical, representing market indecision.
Support and Resistance: The Psychological Boundaries
Support and resistance levels are the psychological floors and ceilings of the market. Support is a price level where buying interest is strong enough to overcome selling pressure, preventing the price from falling further. Conversely, resistance is a ceiling where selling pressure halts a price advance. A critical concept for those who learn technical analysis from scratch is "Role Reversal." When a resistance level is decisively broken, it often transforms into a new support level as the market psychology shifts from skepticism to conviction. This transition is a hallmark of a healthy, trending market.
Traditional Charting vs. AI-Enhanced Analysis: The 2026 Edge
As of early 2026, the integration of artificial intelligence hasn't rendered technical analysis obsolete; it's made the discipline more precise and accessible. A common objection among novices is whether manual charting remains relevant in an era dominated by high-frequency algorithms. The reality is that when you learn technical analysis from scratch today, you're leveraging computational power to eliminate the human bias that historically plagued retail traders. Fear and greed often lead to "revenge trading," a destructive cycle where a professional's discipline collapses after a losing position. AI-enhanced analysis acts as a psychological buffer, providing objective data points that override these emotional impulses and maintain the integrity of your strategy.
Efficiency is the hallmark of the 2026 roadmap. Automated pattern recognition platforms, such as TrendSpider which serves over 15,000 active users as of early 2026, can scan thousands of assets across the global digital ecosystem in seconds. This technology identifies support zones and trendlines that would previously require thousands of hours of manual labor to locate. Additionally, AI-powered video tutors now provide real-time technical support, acting as a digital mentor that analyzes your chart overlays and corrects errors before you commit capital. This ensures your learning path is both accelerated and accurate.
The Evolution of Technical Analysis Tools
Legacy software provided the foundation for market analysis, but modern platforms have transitioned into comprehensive ecosystems. While MetaStock's real-time version costs $100 per month as of May 2026, newer AI-integrated platforms offer Smart Instructor™ technology to provide instant clarification on technical concepts. Achieving excellence in this environment requires a parallel understanding of how to invest in ai to fully capitalize on the shift toward automated analysis. This dual competency ensures you're prepared for the strategic implications of a technology-driven market.
Algorithmic Guardrails for Beginner Traders
AI tools now flag high-probability setups by cross-referencing current price action with decades of historical backtesting data. These systems provide real-time risk management by suggesting optimal stop-loss placements based on intraday volatility calculations rather than arbitrary percentages. By integrating these features, AI democratizes elite institutional-level data for retail learners, ensuring they aren't disadvantaged by the speed of institutional participants. This ensures that as you learn technical analysis from scratch, your foundation is built on verified statistical edges. You're no longer guessing; you're executing a repeatable system backed by the most advanced technology available in the financial landscape.
Your 5-Step Roadmap to Learning Technical Analysis from Scratch
To learn technical analysis from scratch, you need a disciplined progression that mirrors a professional development path. It isn't enough to memorize patterns; you must understand the underlying mechanics of the global digital ecosystem. This roadmap is designed to move you from a novice observer to a data-driven technician capable of navigating 2026's volatile markets with precision and confidence.
The first phase involves mastering the basics of chart reading, specifically Japanese candlesticks and trend identification. Once you can identify market direction, you must progress to Phase 2: Understanding Market Structure. This involves mapping support, resistance, and supply/demand zones where institutional liquidity often resides. Phase 3 introduces technical indicators as filters for your price action analysis. In Phase 4, you'll develop a rigorous risk management framework. With FINRA's 2026 shift toward real-time, risk-based margin calculations, understanding your intraday exposure is mandatory for capital preservation. Finally, Phase 5 focuses on practice through paper trading, using AI feedback loops to refine your execution before risking live capital.
Building Your Technical Indicator Toolkit
Indicators are mathematical derivatives of price and volume designed to provide specific insights. Lagging indicators, such as Moving Averages, confirm trends that have already begun. Leading indicators, like the Relative Strength Index (RSI), help identify potential exhaustion points before a reversal occurs. While it's tempting to use dozens of tools, "less is more" in professional trading. Overloading your charts leads to analysis paralysis, where conflicting signals prevent execution. Focus on a lean toolkit to maintain clarity.
- Moving Averages (MA): Essential for smoothing price data to identify the primary trend direction.
- Relative Strength Index (RSI): A momentum oscillator that measures the speed and change of price movements to identify overbought or oversold conditions.
- MACD (Moving Average Convergence Divergence): A trend-following momentum indicator that shows the relationship between two moving averages of an asset’s price.
The Importance of a Trading Journal
A professional trading journal is your most valuable asset for long-term mastery. Tracking the "what" of a trade is standard, but documenting the "why" is what builds your pattern recognition muscle. You must record your emotional state, the technical rationale for the entry, and the specific risk parameters used. In 2026, you can use AI tools to analyze your journal entries for recurring behavioral errors, such as closing winning positions too early due to anxiety. This objective review process transforms raw data into actionable intelligence. To begin your journey with a structured curriculum, enroll in our Technical Analysis Training today.
Future-Proofing Your Skills with IAB Academy Mastery
IAB Academy serves as the primary bridge between novice exploration and professional mastery within the global digital ecosystem. While the 2026 market offers an abundance of data, the ability to synthesize that information into actionable strategy remains a rare and valuable competency. You've seen how the regulatory environment has shifted toward real-time risk calculations; now you must ensure your education meets those institutional standards. We provide more than just tutorials. We offer a disciplined environment where professionals can achieve excellence through high-density information and industry relevance.
Mastery isn't a destination but a continuous process of refinement. Our Smart Instructor™ technology facilitates this by providing a 24/7 mentor experience available in over 130 languages. This ensures that technical support is always available, whether you're analyzing a midnight breakout or a pre-market gap. By joining our community, you're aligning yourself with a global network committed to professional growth and financial literacy. This isn't just about reading charts; it's about future-proofing your career in an increasingly automated landscape.
The Novice Investor Curriculum
If you're beginning your journey to learn technical analysis from scratch, our Novice Investor Course provides the necessary foundational blocks. Priced at a one-time fee of $99 as of May 2026, this curriculum is specifically modularized to prevent information overload while building high-level proficiency. We also offer specialized teen-focused programs to ensure the next generation of investors enters the market with a data-driven mindset. To understand the broader economic context of these skills, we recommend reviewing our financial literacy curriculum as a parallel resource.
Certification and Career Advancement
An IAB Academy certification carries significant professional weight in the 2026 market. As the SEC increases its focus on the governance of technology and AI within financial firms, having a validated skill set signals compliance and technical mastery to potential partners or employers. The Smart Instructor™ remains a tool for ongoing mastery long after your initial course completion, providing updates as new industry standards emerge. Don't leave your financial future to chance or conflicting online opinions. Enroll in the IAB Technical Analysis Training today to secure your position at the forefront of the digital trading ecosystem.
Secure Your Technical Mastery in the 2026 Market
The elimination of the $25,000 equity requirement for day traders in April 2026 has fundamentally altered the retail landscape. Success in this modern digital ecosystem requires a shift from speculative guessing to a disciplined, data-driven approach. You now have the roadmap to learn technical analysis from scratch by mastering price action, volume dynamics, and the psychological boundaries of support and resistance. By integrating AI-powered tools into your workflow, you neutralize emotional bias and gain the institutional-level precision necessary for long-term career survival.
Your path to excellence is supported by professional validation and elite mentorship. IAB Academy provides the infrastructure needed to transition from novice to master. You'll receive instant support in 130+ languages via our Smart Instructor™ and maintain an edge with lifetime access to all 2026 course updates. Our globally recognized investing certifications ensure your skills meet the highest industry standards. It's time to take control of your financial education and achieve the sense of mastery you deserve. Master Technical Analysis with AI-Powered Tutoring at IAB Academy today and begin shaping your professional future with confidence.
Frequently Asked Questions
Is technical analysis difficult to learn for absolute beginners?
Technical analysis is intellectually accessible but requires significant emotional discipline to master. The primary challenge for beginners isn't the complexity of the charts; it's the ability to remain objective amidst market noise. Most novices can grasp the core concepts of price action and trend identification within a few weeks of structured study.
How much time does it take to learn technical analysis from scratch?
Achieving a baseline of competency typically requires 3 to 6 months of consistent study and paper trading. To learn technical analysis from scratch and reach a professional level of mastery, you must commit to a modular curriculum that includes at least 100 hours of historical backtesting. This steady, disciplined pace ensures you absorb technical details before transitioning to complex strategic implications.
Does technical analysis actually work in volatile markets?
Technical analysis is specifically designed to navigate volatility by identifying supply and demand imbalances in real time. During the significant sector rotation observed in early 2026, technical levels provided objective boundaries for risk management that fundamental data often lagged behind. It remains the most reliable method for distinguishing signal from noise in fast-moving digital ecosystems.
Can I learn technical analysis for free, or should I pay for a course?
Free resources offer fragmented information that often leads to information overload and conflicting strategies. A professional course provides a cohesive, validated roadmap and the institutional credibility of a certification. Investing in a structured program ensures you receive the most accurate and up-to-date information available, which is essential for career survival in competitive markets.
What is the best technical indicator for a beginner to start with?
The 200-day Simple Moving Average (SMA) is the most effective starting point for any beginner. It provides an objective view of the long-term trend and acts as a definitive filter for market bias. By focusing on this single, high-authority indicator, you avoid the analysis paralysis that often occurs when using too many tools simultaneously.
How is AI changing the way technical analysis is taught?
AI has transformed the educational experience by providing 24/7 personalized mentorship through tools like the Smart Instructor. These systems allow students to learn technical analysis from scratch with immediate feedback in 130+ languages. This technology democratizes elite institutional-level data, making professional-grade analysis accessible to retail learners for the first time.
Do I need a background in math or finance to understand chart patterns?
You don't need an advanced degree in mathematics or finance to become a proficient technician. Technical analysis is primarily a visual and psychological discipline rooted in human behavioral tendencies. While basic arithmetic is required for position sizing and risk management, the core skill is recognizing recurring geometric patterns on a price chart.
What is the difference between technical analysis and day trading?
Technical analysis is a methodology used to evaluate assets; day trading is a specific execution style. You can apply technical analysis to any timeframe, including long-term investing or swing trading. Day trading simply involves using these technical tools to capitalize on intraday price fluctuations, with all positions typically closed before the market session ends.
